Principle component analysis
Overview
The Principal Component Analysis (PCA) module in our application is designed to reduce the dimensionality of genotype data, making it easier to visualize and interpret the relationships between different samples. This analysis helps in understanding the genetic structure and identifying population stratification within the dataset.
Purpose
PCA is used to identify the main axes of genetic variation in the dataset. By projecting the genotype data onto these principal components, we can visualize the genetic relationships between samples and detect patterns of population structure.
Methodology
The PCA analysis is performed using genotype data and PLINK v1.90b7 64-bit (16 Jan 2023). PLINK is a widely used tool for genetic data analysis.
The following PLINK command is executed to perform the PCA analysis:
plink \
--bfile plink \
--out pca \
--pca 2
Explanation of the flags used
| Flag | value | Environment |
|---|---|---|
| --bfile | plink | Specifies the base name of the binary fileset (BED, BIM, and FAM files) to be used. |
| --out | pca | Specifies the base name for the output files. |
| --pca | 2 | Computes the first two principal components for visualization. |
Visualization
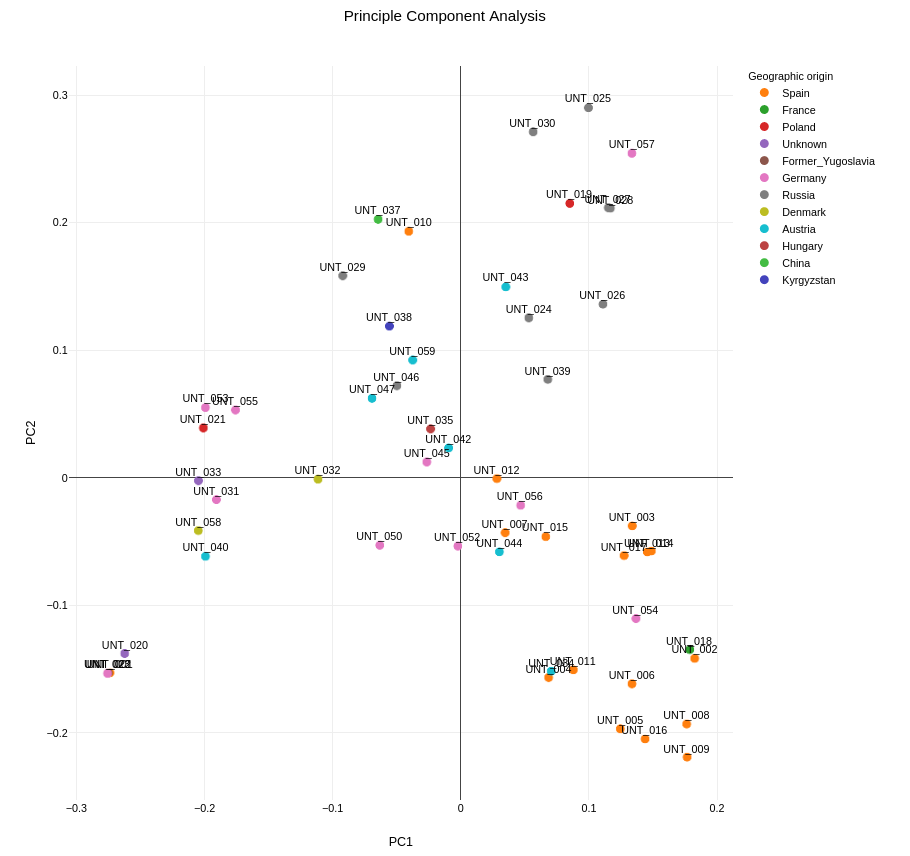
The PCA plot is visualized using a custom JavaScript component, which colors the points based on their geographic origin. This enhances the interpretability of the plot by allowing users to see how genetic variation correlates with geographic location.
Each point in the plot represents a sample, and the colors indicate the geographic origin of the samples. This visualization helps in identifying population structure and understanding the genetic diversity within the dataset.