1. Manhattan plot
A Manhattan plot is a type of scatter plot used in genomics to display data, typically the results of a genome-wide association study (GWAS). Each point on the plot represents a single nucleotide polymorphism (SNP). The x-axis corresponds to the position of the SNPs along the genome, while the y-axis represents the negative logarithm of the p-value for the association between the SNP and a trait. After conducting GWAS analysis in Camelina Hub a Manhattan plot is autogenerated. Below is a description of how it is calculated and created.
- The Plink WebAssembly module performs the GWAS analysis and returns unadjusted p-values.
- P-values are converted to the negative logarithm base 10 scale: $−log10(p_-value)$.
- The converted p-values are then sorted based on chromosome and position.
- Alternating colors are assigned to different chromosomes for visual clarity.
- A custom javascript component is employed to render an interactive Manhattan plot having genomic positions on the x-axis and the -log10(p-value) on the y-axis.
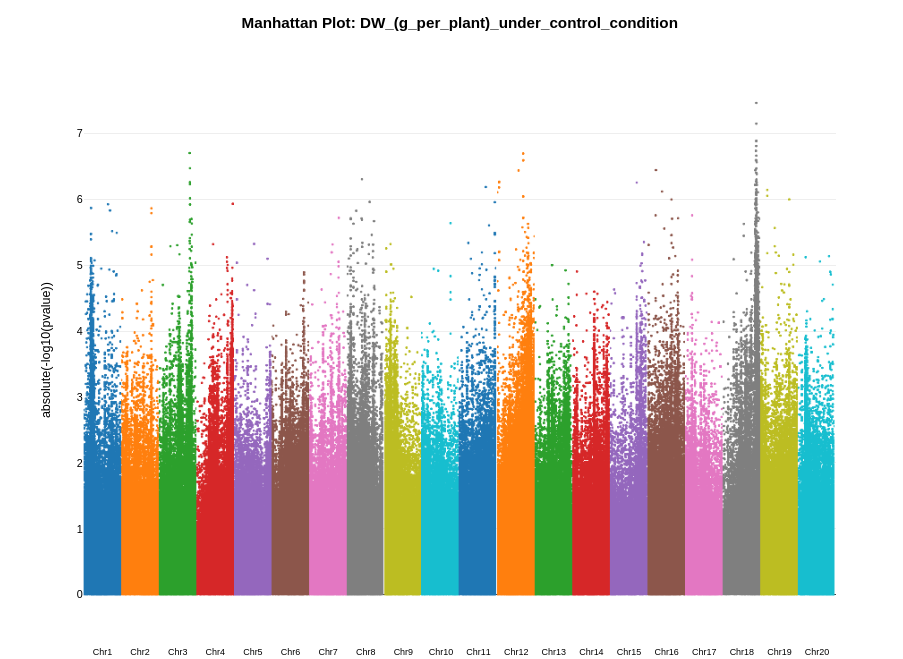
Significance threshold
In this Manhattan plot, we have visualized the p-values of SNP associations across the genome without including a specific significance threshold line. The determination of significance thresholds can vary depending on the study design, the number of tests performed, and the field of research. By not including a fixed threshold, we allow for flexibility in interpretation and encourage viewers to consider multiple criteria for assessing the significance of associations. This approach respects the various schools of thought regarding the identification of significant SNPs in genome-wide studies.
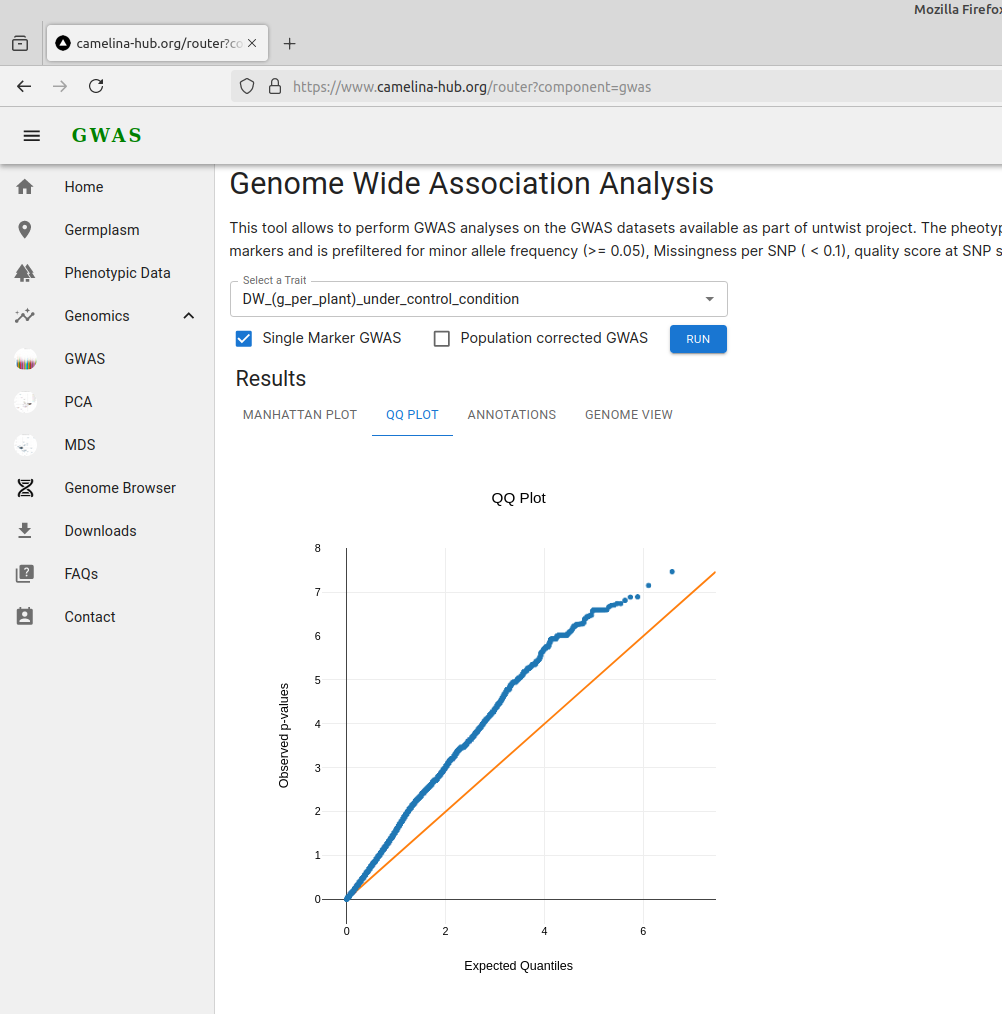
2. Quantile-quantile plot
A QQ plot (Quantile-Quantile plot) is a graphical tool used to compare two probability distributions by plotting their quantiles against each other. In the context of genome-wide association studies (GWAS), a QQ plot is commonly used to compare the distribution of observed p-values with the expected distribution under the null hypothesis of no association. This helps to assess whether there are any deviations from the null hypothesis, indicating potential associations between SNPs and the trait of interest.
Using the same p-values as of Manhattan plot:
- The Plink WebAssembly module performs the GWAS analysis and returns unadjusted p-values.
- Expected p-values are generated under the null hypothesis. These expected p-values follow a uniform distribution between 0 and 1.
- Both observed and expected p-values are converted to the negative logarithm base 10 scale: $−log10(p_-value)$.
- Observed p-values are sorted in ascending order.
- Expected p-values are also sorted to match the order of the observed p-values.
- The sorted observed p-values are plotted on the y-axis and the the sorted expected p-values are plotted on the x-axis.
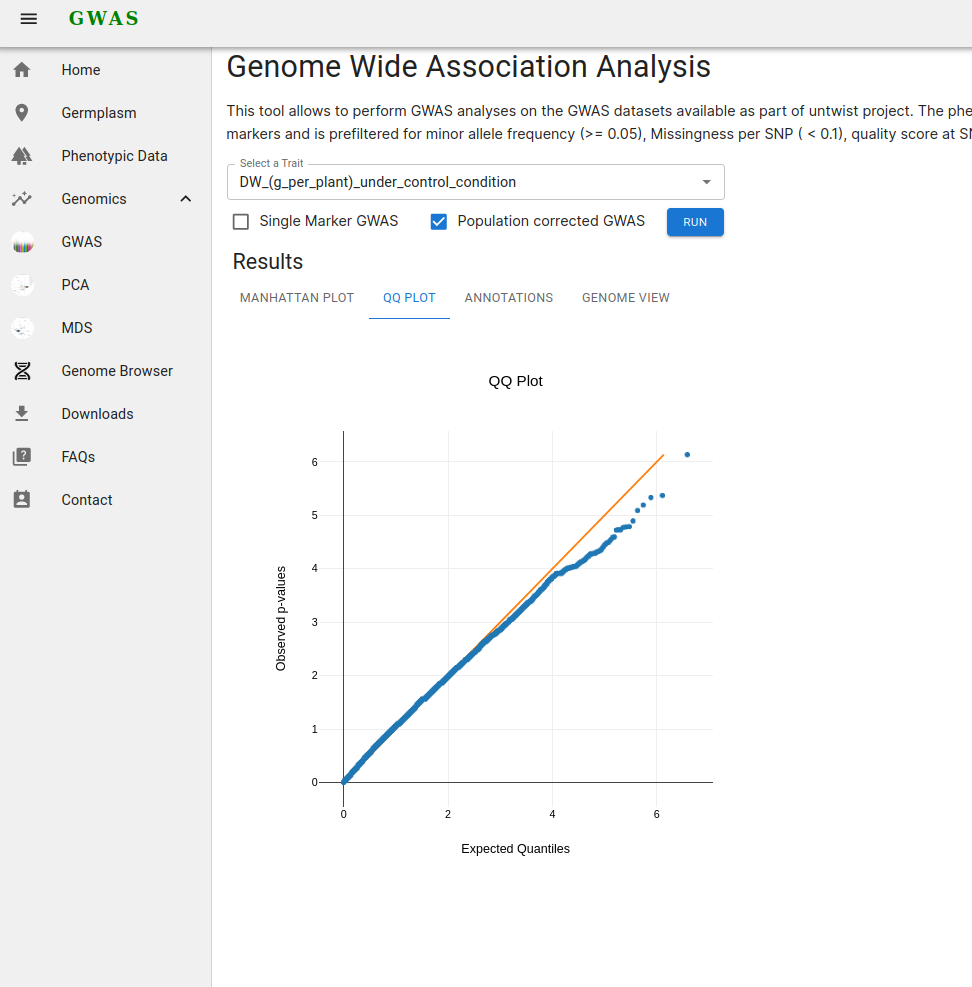
- A reference line is drawn with a slope of 1, representing the null hypothesis where observed and expected p-values follow the same distribution.
- A custom JavaScript component is employed to render an interactive QQ plot, allowing users to explore the distribution of p-values.
QQ-plot for GWAS analyses conducted without correction for population structure
QQ-plot for GWAS analyses with correction for population structure
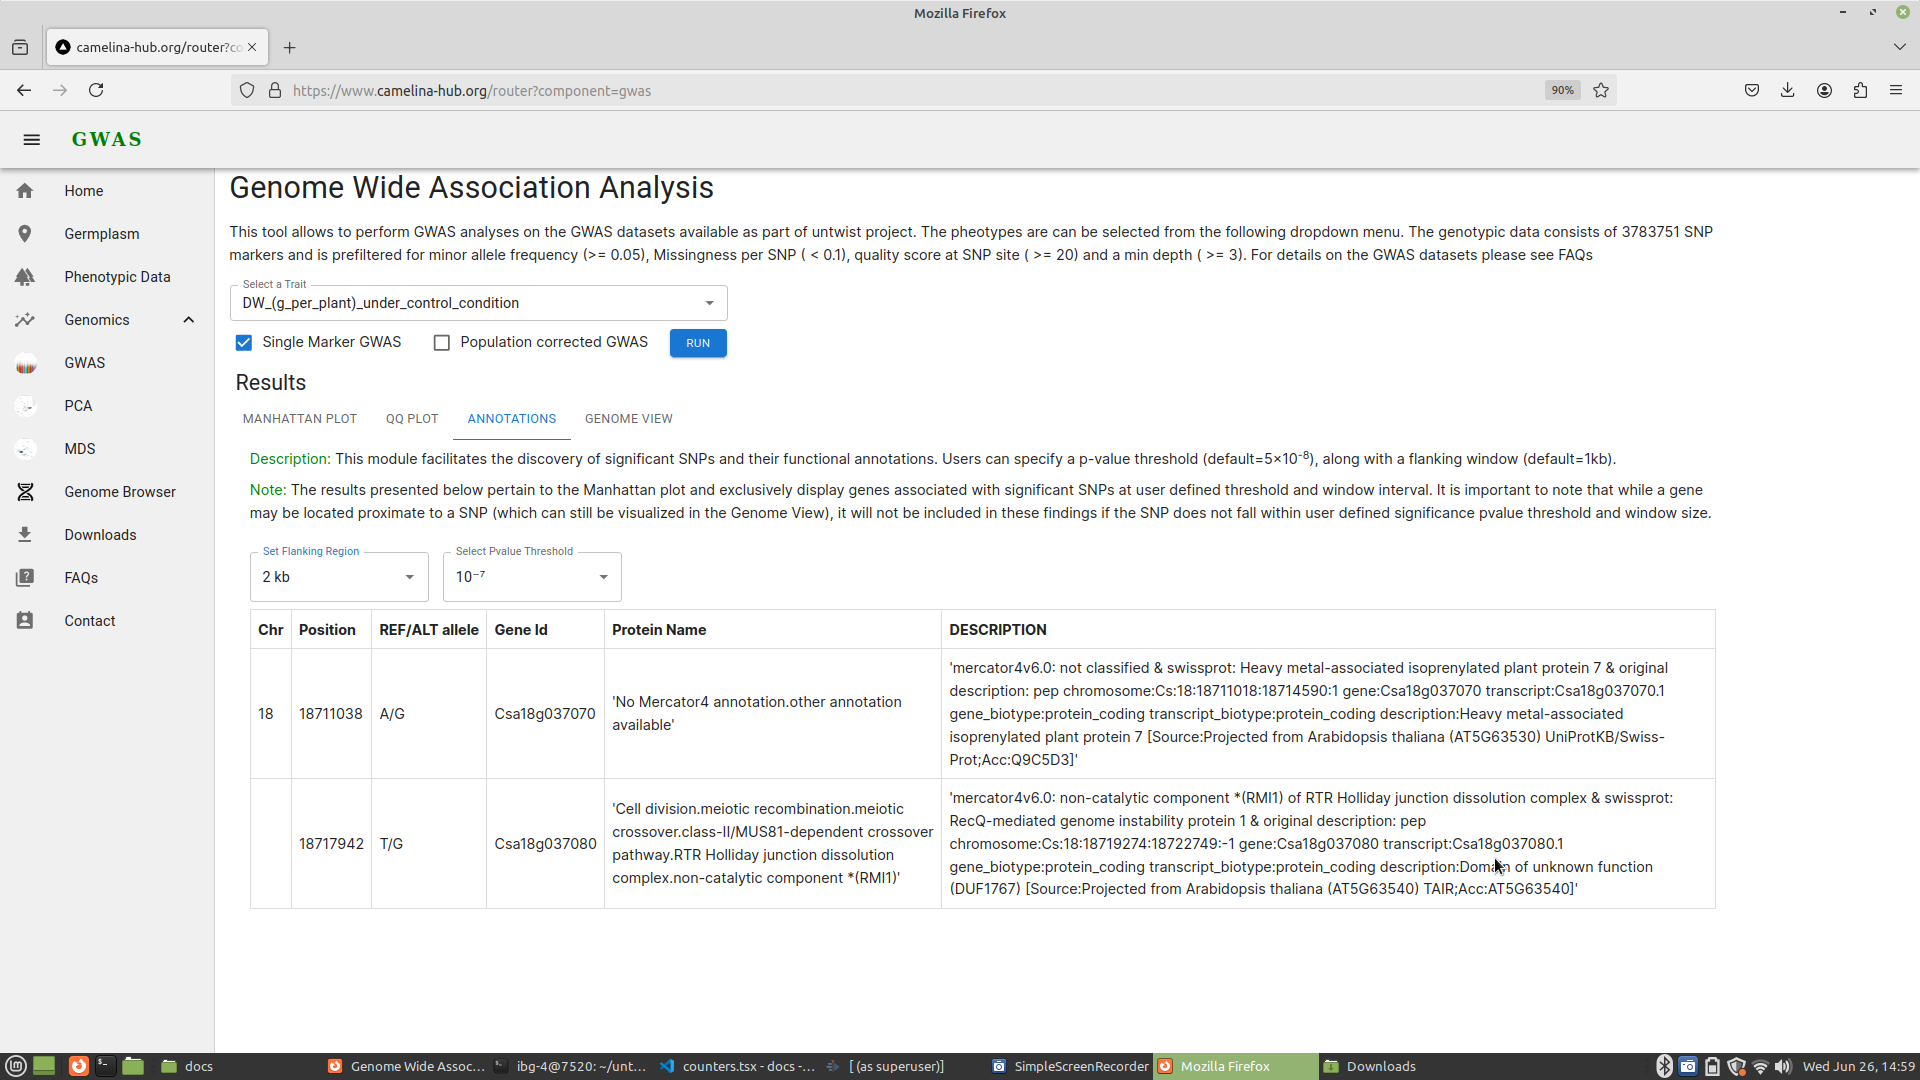
3. Functional gene annotation
Following association analysis, functional gene annotation is a crucial step in the interpretation of genome-wide association study (GWAS) results. It helps researchers identify and understand the genes associated with significant single nucleotide polymorphisms (SNPs), facilitating further studies on the biological mechanisms underlying traits. The gene annotation component developed in Camelina Hub allows users to find genes associated with SNP positions. It provides the flexibility to filter genes based on user-defined p-value thresholds and window sizes around SNP positions.
4. Multi-omics integration
The integration of multi-omics data provides a comprehensive view of the biological processes underlying various traits and conditions. In Camelina Hub, we have integrated RNA-seq data along with variant data and ensembl gene model data, facilitating an in-depth analysis of gene expression across different conditions and tissues.
The RNA-seq data integrated into Camelina Hub is displayed in a genome browser, providing users with an intuitive way to explore gene expression patterns alongside genomic variants and gene models.
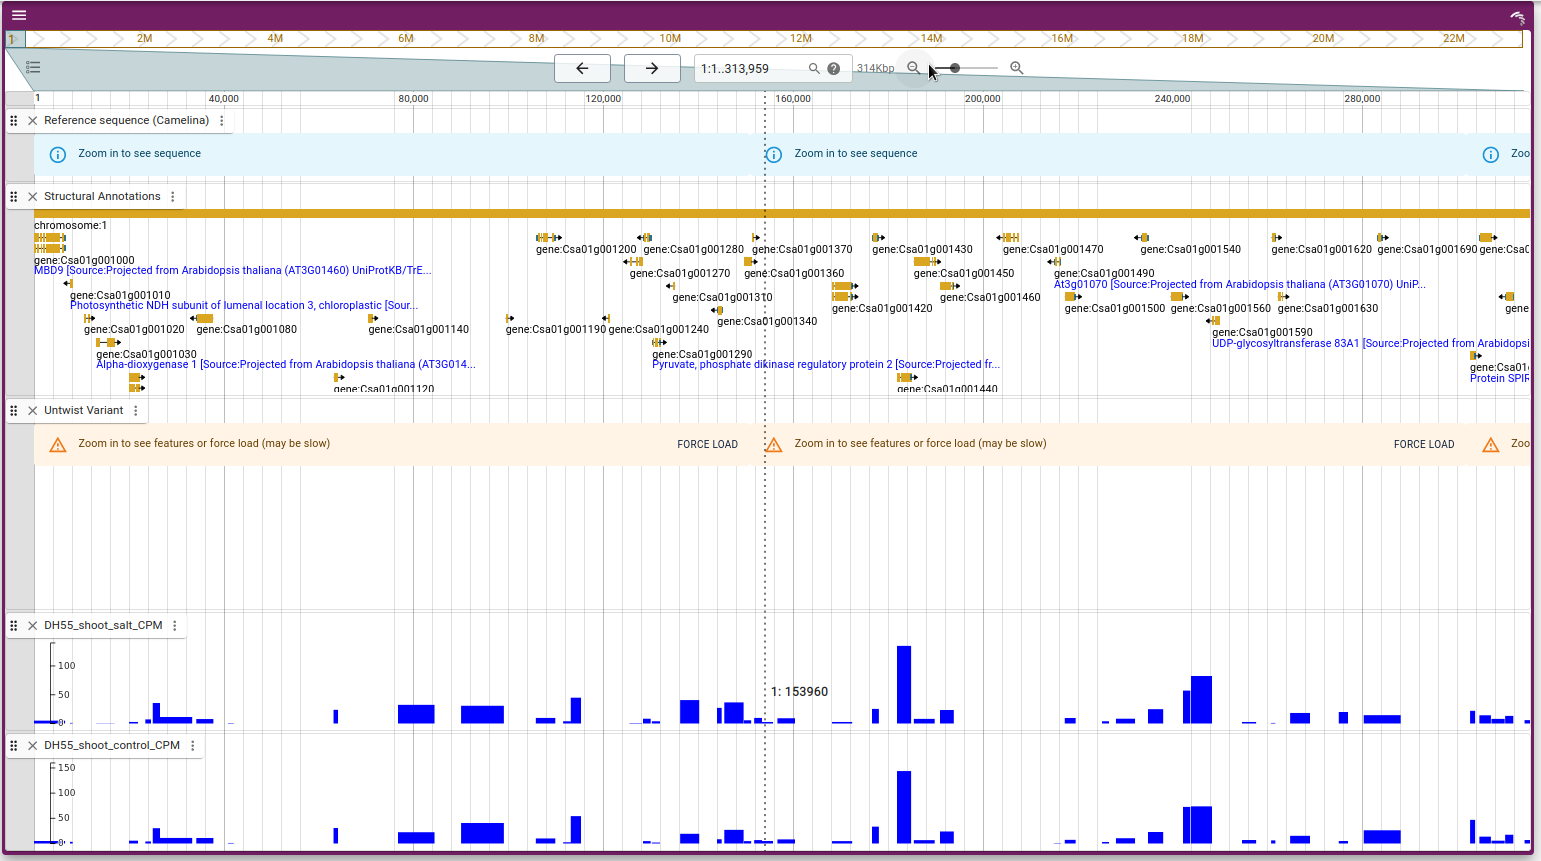
For data sources and experiments see datasets.