Multidimentional scaling (MDS)
Overview
The Multidimensional Scaling (MDS) module in our application is designed to visualize the genetic distance between samples based on genotype data. This analysis helps in understanding the genetic structure and identifying potential clusters within the dataset.
Purpose
MDS is used to reduce the dimensionality of genotype data, making it easier to visualize and interpret the relationships between different samples. By plotting the samples in a two-dimensional space, we can identify clusters and patterns that may indicate shared ancestry or genetic similarity.
Methodology
The MDS analysis is performed using genotype data and the PLINK WebAssembly module. PLINK is a widely used tool for genetic data analysis, and the WebAssembly module allows it to be run efficiently in a web environment.
The following PLINK command is executed to perform the MDS analysis:
plink \
--bfile plink \
--read-genome plink.genome \
--cluster \
--K 5 \
--mds-plot 2
Explanation of the flags used
| Flag | value | Environment |
|---|---|---|
| --bfile | plink | Specifies the base name of the binary fileset (BED, BIM, and FAM files) to be used. |
| --read-genome | plink.genome | Reads the genome file containing pairwise IBS (Identity by State) distance information. |
| --cluster | -- | Performs clustering on the genotype data. |
| --K | 5 | Specifies that the number of clusters (K) to be identified is 5. |
| --mds-plot | 2 | Generates a 2-dimensional MDS plot |
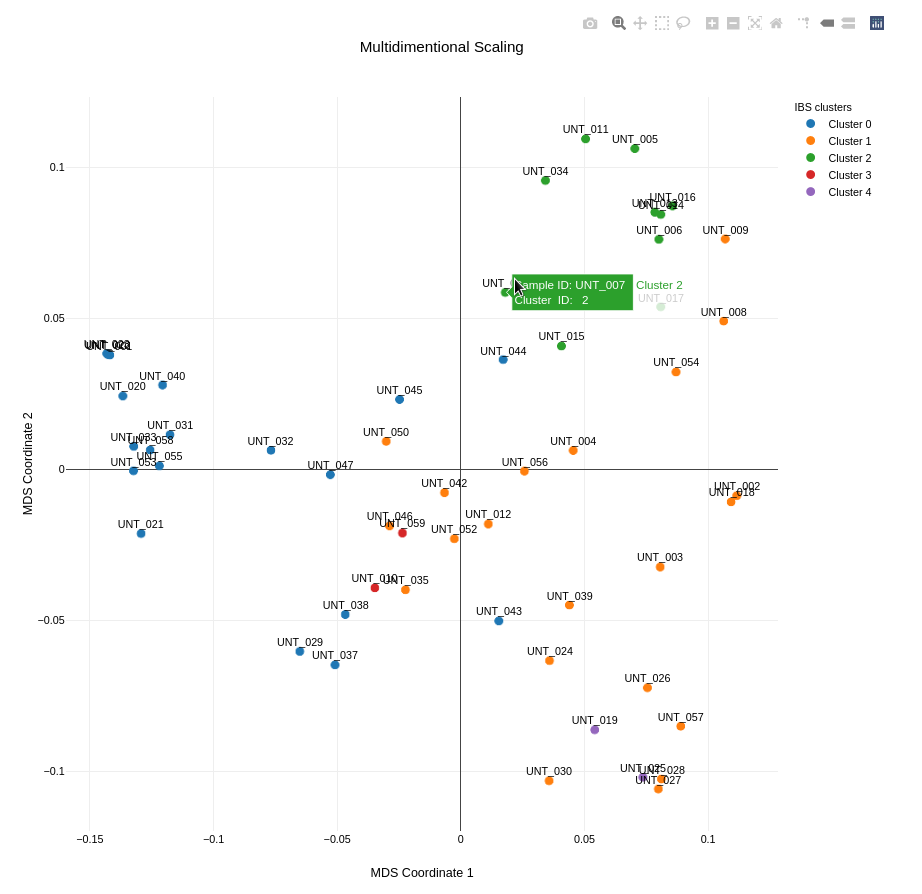
Visualization
The result of the MDS analysis is a plot that visualizes the genetic distances between samples in two dimensions. The plot below shows five clusters based on IBS distance, highlighting the genetic relationships within the dataset.
Each point in the plot represents a sample, and the colors indicate the different clusters identified by the analysis. This visualization helps in identifying potential sub-populations and understanding the genetic diversity within the dataset.