Genome Wide Association Analysis (GWAS)
How the app performs the GWAS analysis:
This application utilizes a custom WebAssembly module specifically designed for in browser GWAS analysis. WebAssembly is a web technology that allows compiling code written in languages like C++ to run efficiently within web browsers. This enables complex computations like GWAS to be performed directly in the browser without requiring users to download and install software. This WebAssembly module leverages functionalities from PLINK 1.07, a widely used open-source software suite for whole-genome association studies. PLINK provides tools for data management, quality control, and various GWAS analysis methods. For further details, please refer to the Plink documentation (opens in a new tab).
GWAS analysis without correction for population structure:
This approach utilizes the --assoc option in PLINK, which performs a simple chi-square test for each SNP (single nucleotide polymorphism) to assess its association with the chosen camelina phenotype (trait) data.
No explicit correction for population stratification is applied in this method. While this can be faster, it is susceptible to identifying false positives due to ancestry differences.
To perform the GWAS analysis without correction for population structure, the WebAssembly module runs the following command in the background of your browser:
plink \
    --bfile plink \
    --assoc \
    --allow-no-sex
Here is an explanation of each flag used in the command:
| Flag | value | Environment |
|---|---|---|
| --bfile | plink | This flag specifies the base name of the binary fileset. In PLINK, a binary fileset typically consists of three files: .bed (binary genotype file), .bim (binary SNP information file), and .fam (family information file). By providing the base name plink, the module knows to look for plink.bed, plink.bim, and plink.fam |
| --assoc | -- | This flag tells PLINK to perform a basic case/control association test, which is a chi-square test for each SNP. This test examines whether allele frequencies at each SNP differ significantly between cases (individuals with the phenotype) and controls (individuals without the phenotype). If the phenotype is quantitative, PLINK will automatically treat the analysis as a quantitative trait analysis and apply a regression model. |
| --allow-no-sex | -- | This flag allows PLINK to proceed with the analysis even if some individuals have unknown sex information. In genetic studies, sex is often a critical covariate, but for some datasets or specific analyses, it may be permissible to ignore this information. |
Important Considerations
Population Stratification: As mentioned earlier, this method does not correct for population stratification. Therefore, any significant associations found may be influenced by underlying population structure. This means that some associations could be false positives, resulting from differences in ancestry rather than a true genetic association with the trait.
Data Quality: The data quality is preprocessed for minor allele frequency (>= 0.05), missingness per SNP ( < 0.1), quality score at SNP site ( >= 20), and a min depth ( >= 3).
Interpretation of Results: Always be cautious when interpreting GWAS results without population structure correction. It is recommended to validate significant findings using independent datasets or additional methods that account for population stratification.
GWAS analysis with correction for population structure:
This approach employs a linear regression model (--linear) with covariate adjustments (--covar). Additional principal components (PCs) or eigenvectors from a separate analysis are included as covariates. These components capture genetic variations due to ancestry and are used to account for population structure in the association test. This method is more robust and helps to reduce spurious associations arising from population stratification.
To perform the GWAS analysis with correction for population structure, the WebAssembly module runs the following command in the background of your browser:
plink \
    --bfile plink \
    --linear \
    --covar plink.cov \
    --covar-name COV1,COV2 \
    --allow-no-sex \
    --standard-beta \
    --hide-covar
Here is an explanation of each flag used in the command:
| Flag | value | Environment |
|---|---|---|
| --bfile | plink | This flag specifies the base name of the binary fileset. In PLINK, a binary fileset typically consists of three files: .bed (binary genotype file), .bim (binary SNP information file), and .fam (family information file). By providing the base name plink, the module knows to look for plink.bed, plink.bim, and plink.fam. |
| --linear | -- | This flag tells PLINK to perform a linear regression analysis, which models the relationship between each SNP and the phenotype while adjusting for covariates. This approach helps in controlling for confounding variables. |
| --covar | plink.cov | This flag specifies the file containing covariates to be included in the regression model. In this case, plink.cov is the file that contains the first two principal components (PCs) derived from a separate analysis. |
| --covar-name | COV1,COV2 | This flag specifies the names of the covariates in the plink.cov file which should be included in the analysis. Here, COV1 and COV2 are the first two principal components used to correct for population structure. |
| --allow-no-sex | -- | This flag allows PLINK to proceed with the analysis even if some individuals have unknown sex information. In genetic studies, sex is often a critical covariate, but for some datasets or specific analyses, it may be permissible to ignore this information. |
| --standard-beta | -- | This flag outputs standardized regression coefficients, which can be useful for comparing the effects of different SNPs on the phenotype. |
| --hide-covar | -- | This flag suppresses the output of covariate effects in the results, focusing the output on the SNP associations. |
Important Considerations
Population Stratification: This method corrects for population stratification by including principal components as covariates. This helps reduce false positives due to underlying population structure, leading to more reliable associations.
Data Quality: It follows the same quality measures for the data as outlined above.
Interpretation of Results: Always interpret GWAS results cautiously. Even with population structure correction, it is recommended to validate significant findings using independent datasets or additional methods.
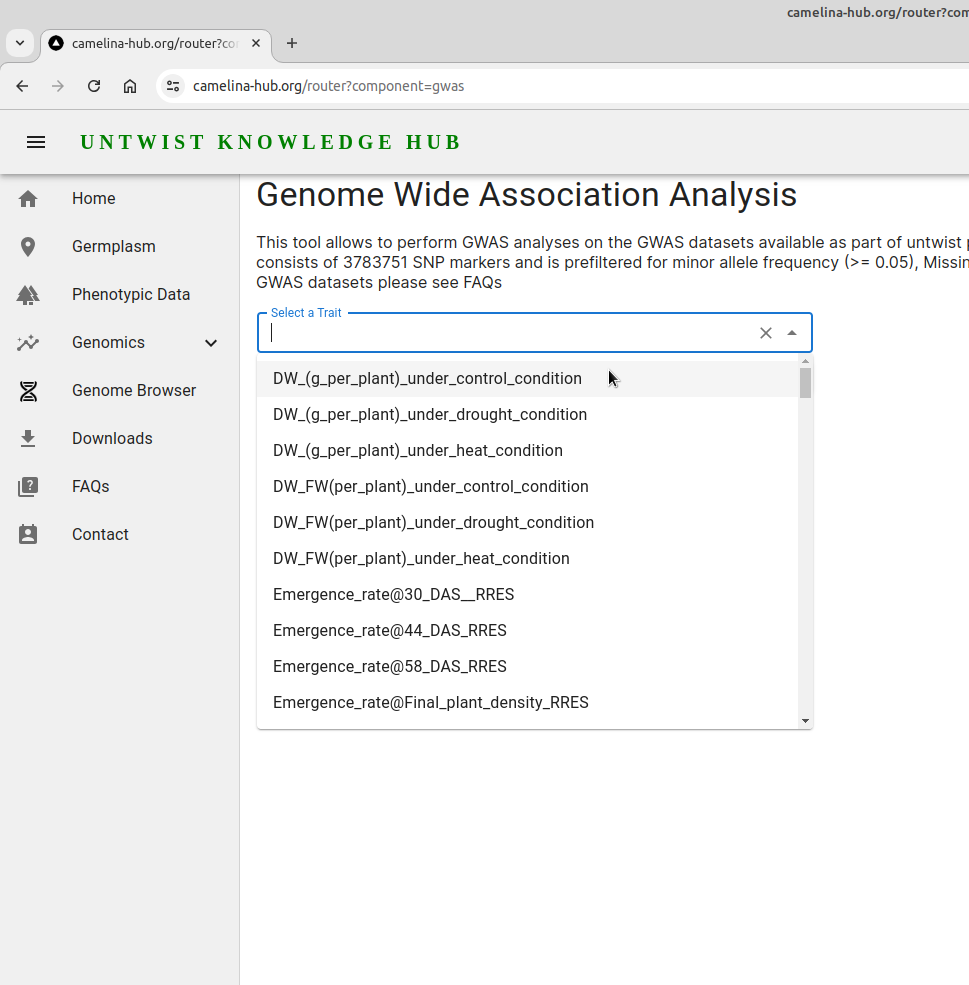
Phenotype Data Selection:
The application also offers flexibility by allowing users to select various camelina phenotype datasets for GWAS analysis. This enables researchers to investigate the genetic underpinnings of different traits in camelina.
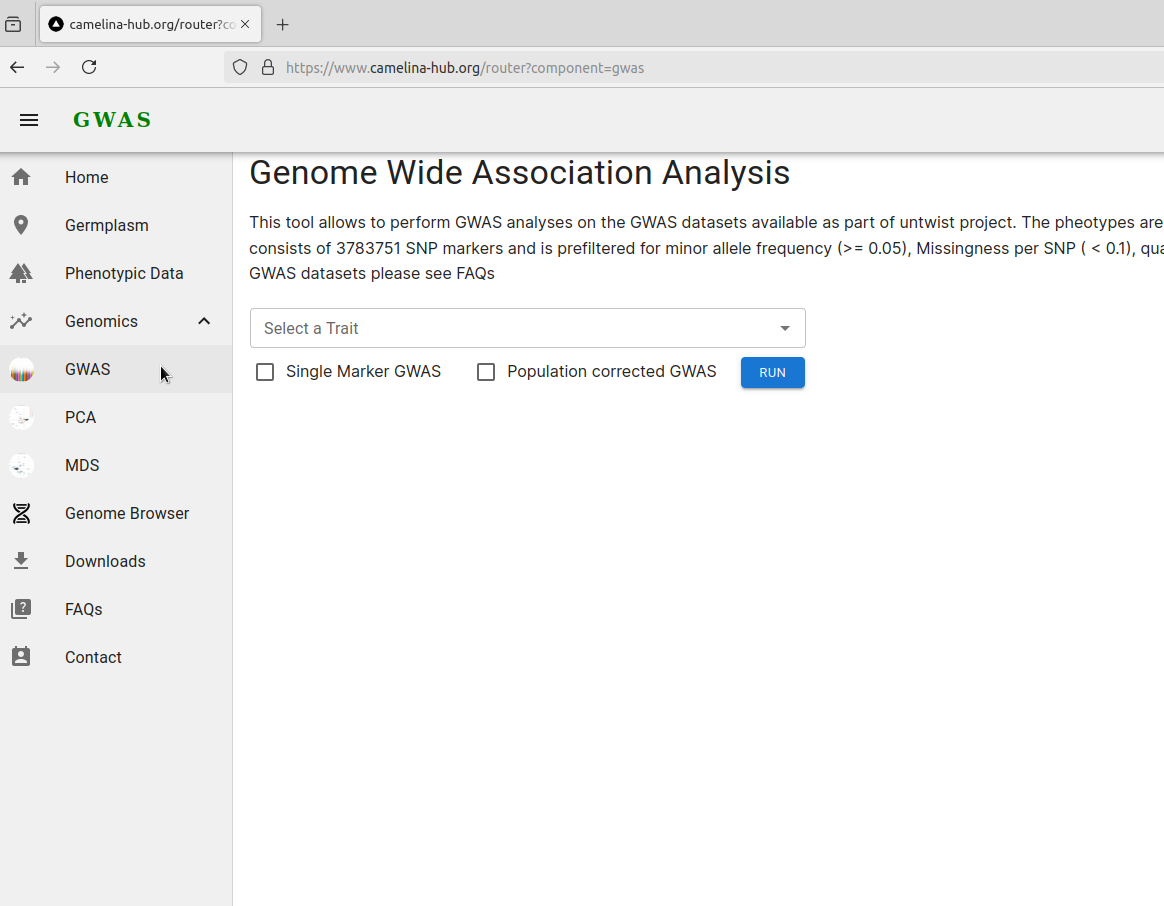
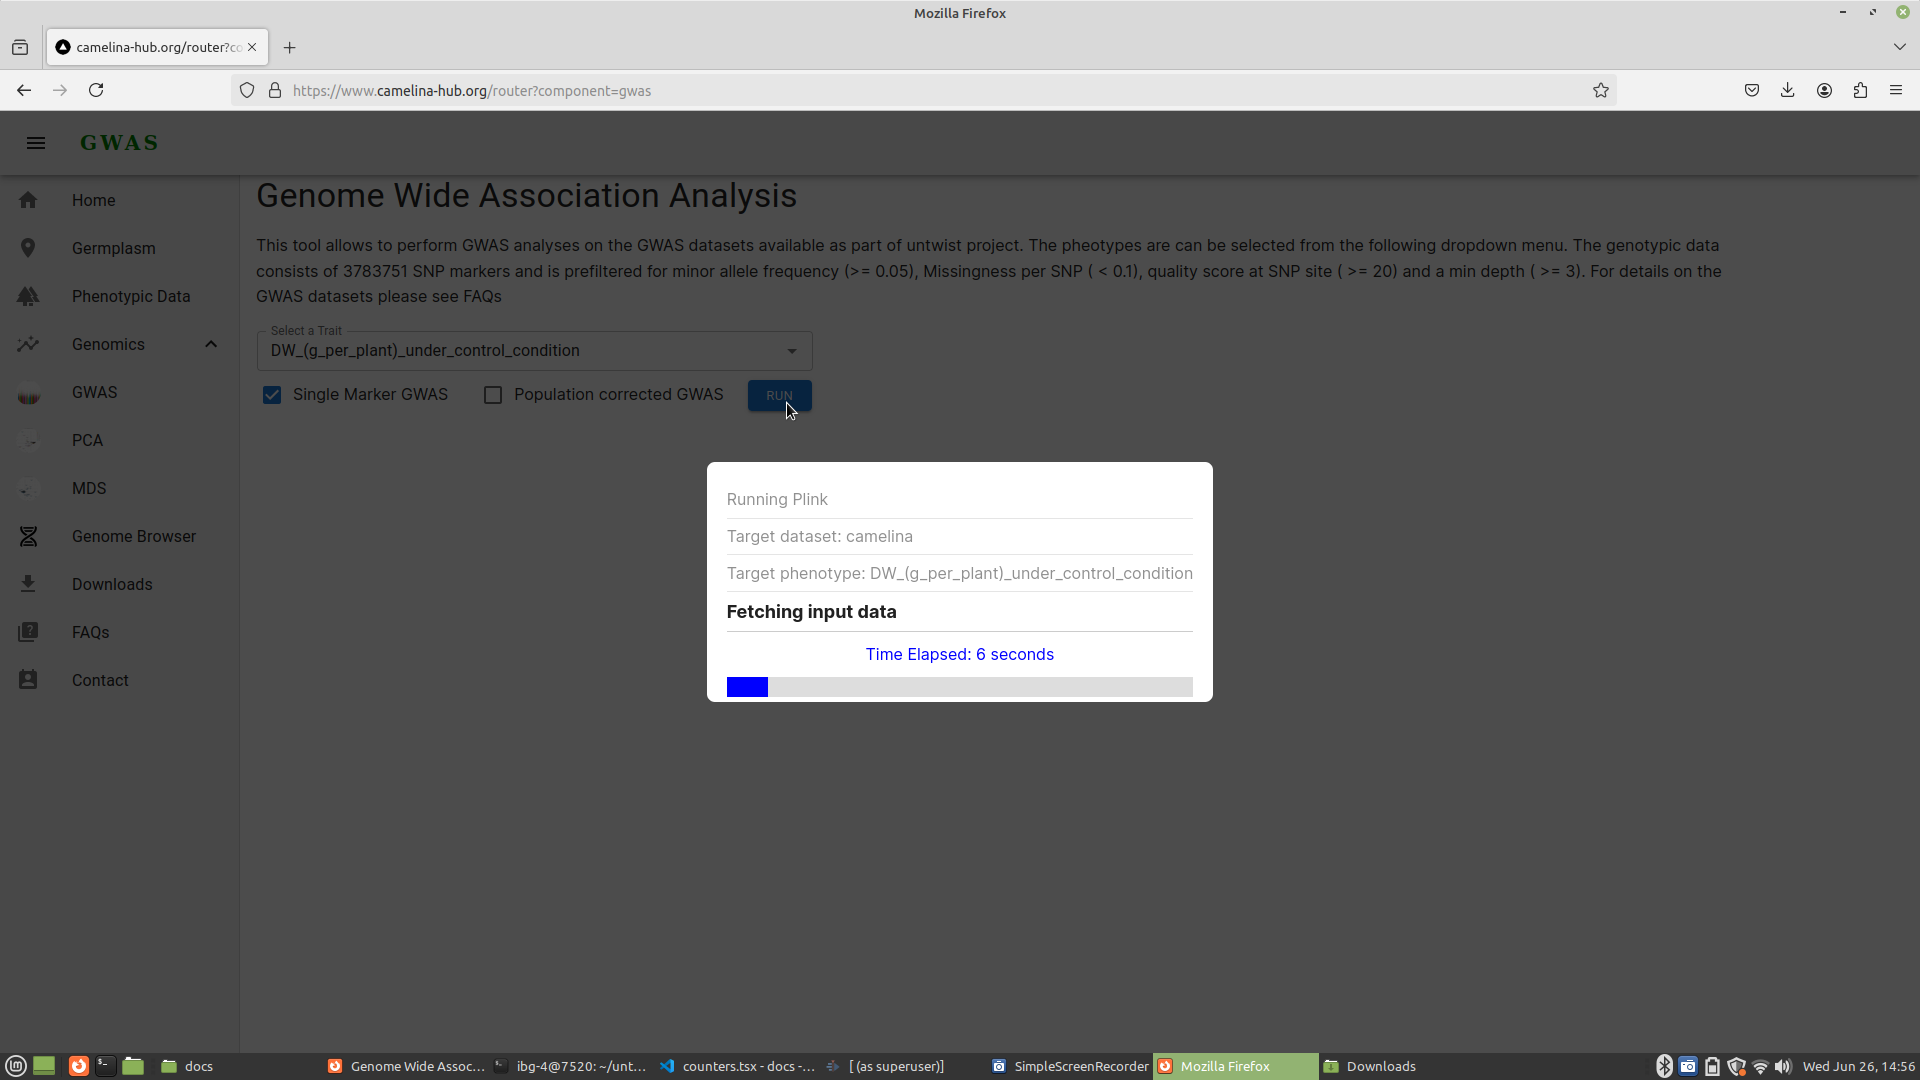
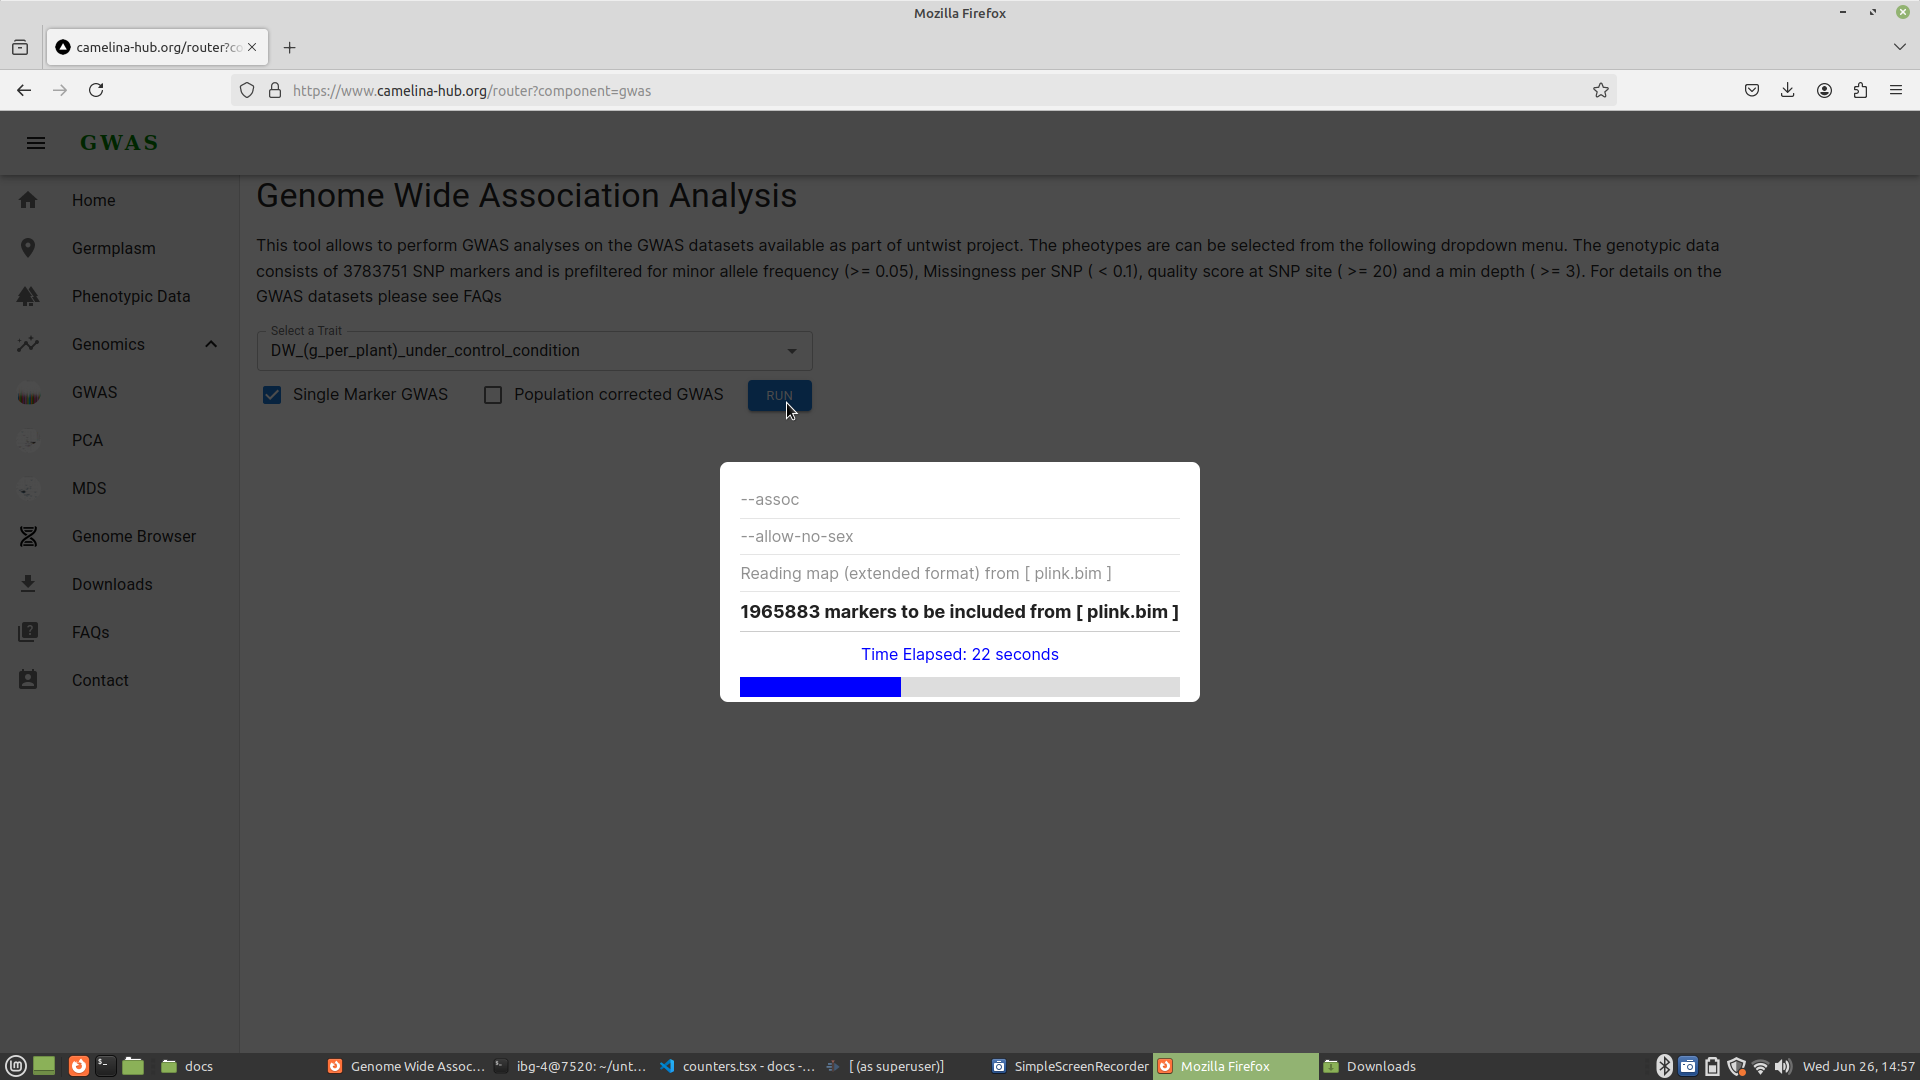
How to perform GWAS in your browser:
- Choose either of the GWAS options with or without correction option
- Press run
Navigate to GWAS module (opens in a new tab)
Select a trait
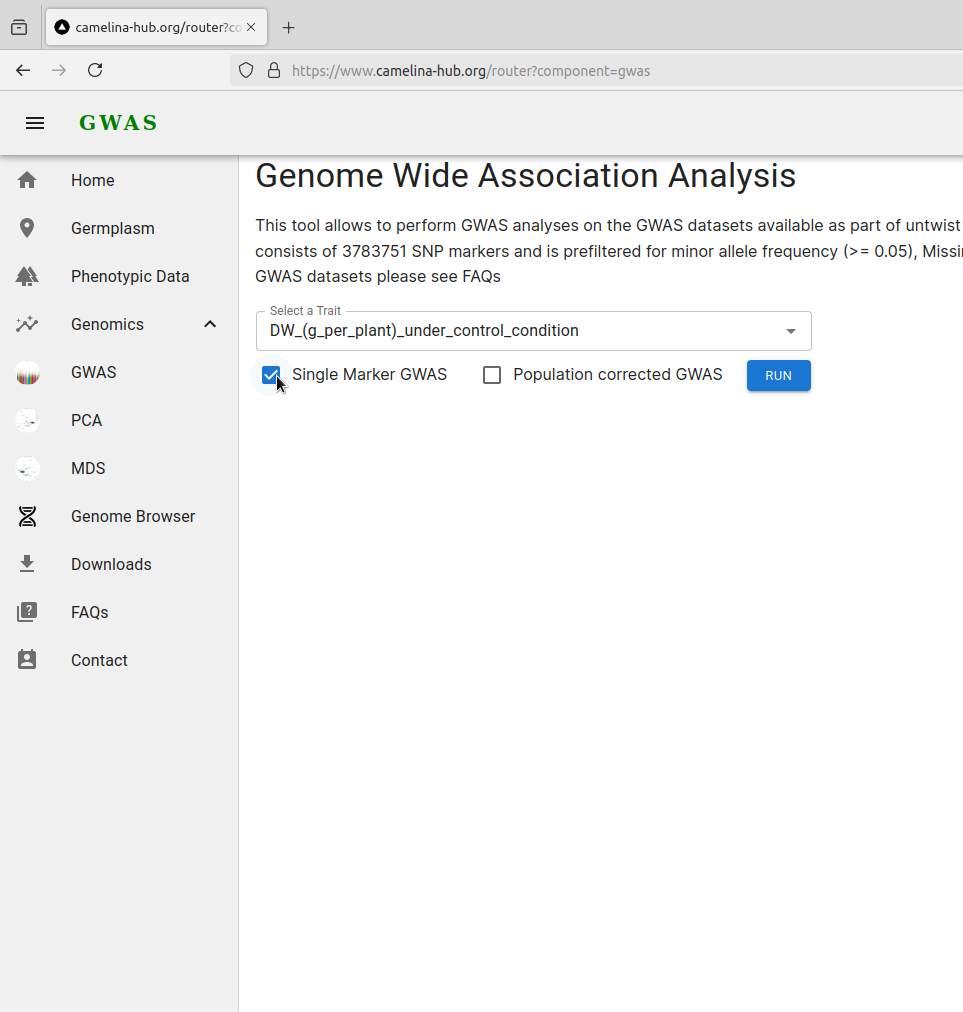
Choose one of the GWAS options with or without correction option
Click run
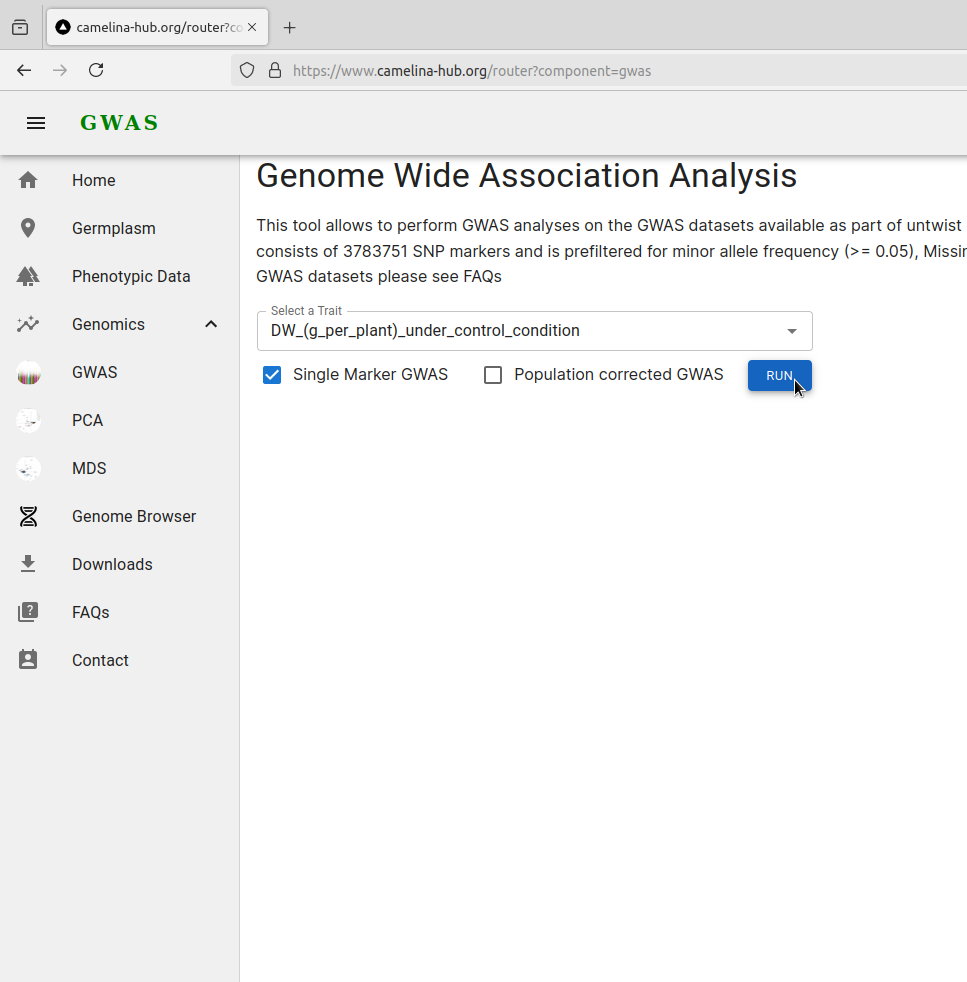
Track the progress
Visualizations/Results
After the completion of GWAS analysis, the following plots are created based the selected phenotype.
- Manhattan plot
- Qunatile quantile plot
- Functional gene annotation
- Multiomics data analysis with genome browser
Click Results to read more on GWAS results.